In previous posts, I explored how AI and self-driving laboratories can accelerate materials discovery. However, I also argued that we need to be able to explain, reproduce, and question the automated results these labs spit out. Failure analysis, another area of discovery with progress I’m invested in, raises the same concern. To know how a material failed, we must be able to reconstruct and understand the changes that led to such failure. Different modes of evidence such as photographs, graphs, sound recordings, scans, and simulations come together to facilitate this analysis by making engineering evidence easier to interpret, compare, and verify.
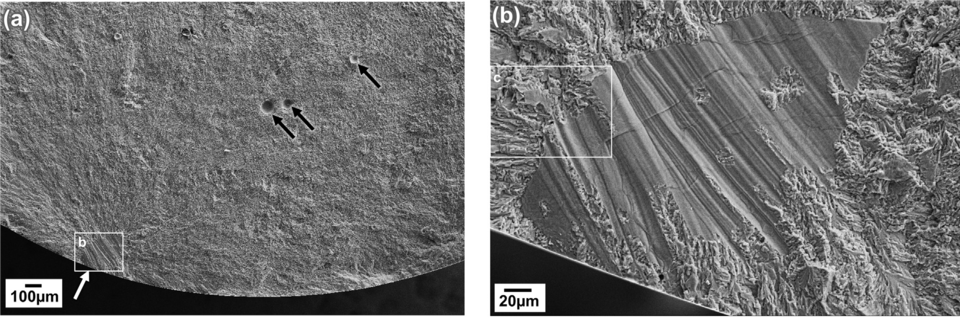
Image taken from the National Institute of Standards & Technology
Investigating how a material failed almost always begins by inspecting the material’s surface. For this, photographs establish whether things like corrosion, deformation, pores, or the direction of crack growth contributed to material failure. The additions of things like scale bars, arrows, and labels can then transform these images from interesting exhibits into technical evidence. In its research on fatigue and fracture in additively manufactured metals, NIST examines how defects created during manufacturing can influence where cracks begin and how they spread.
That said, an image usually shows only the result of failure. To understand the process that led to that result, engineers must dig deeper and connect that visible damage to measurements collected while the material was under stress.
Image taken from Iowa State University
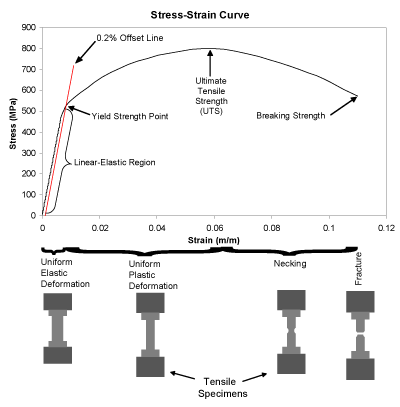
Engineers will often use tensile tests, for example, to pull a prepared specimen while recording its applied load and deformation. The resulting stress–strain graph distills many complicated and often minute measurements into a recognizable pattern over the long term. It’s obvious to see from charts like the one above how the material stops behaving elastically, begins permanently deforming, and eventually fails.
This kind of visualization also supports the human-centered approach to AI-labs and research discussed in my earlier posts. While automated laboratories may collect measurements and recommend another experiment, manual verification of that data by seasoned experts is vital to capture unexpected behavior and to determine whether the system’s conclusion makes sense. A NIST and ASTM workshop on additively manufactured components similarly identified monitoring, modeling, and nondestructive inspection as important parts of understanding material performance.
However, the ability of stress-strain curves to measure long-term behavior is also one of their shortfalls, as they then don’t capture some damage events that occur so suddenly that another form of sensing is needed. In those cases, engineers may listen for the moment the material changes.
Audio taken from the research article, Listening to Radiation Damage In Situ: Passive and Active Acoustic Techniques
Cracking and other irreversible changes can rapidly release elastic waves through materials to provide that sound cue. Acoustic-emission sensors record these signals, allowing engineers to identify damage while it is developing rather than only examining the final fracture. The American Society for Nondestructive Testing explains that acoustic-emission testing can detect energy released when materials deform or cracks grow.
This is especially relevant to autonomous laboratories seeing as sensors can collect data continuously, with algorithms being able to manage copious amounts of such data. As stated, however, humans are still vital in determining whether such signals represent real damage, or whether they’re simply background noise.
In instances where a sound indicates that something has happened but not necessarily where it happened, though, it’s often useful to combine acoustic monitoring with a method that can probe beneath the material’s surface.
Image taken from the National Institute of Standards & Technology
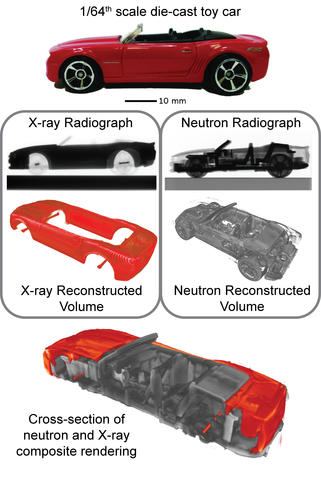
NIST’s NeXT is an example of one such tool, combining neutron imaging and X-ray tomography to produce a single composite scan of the material. This, in turn, provides complementary information about a material’s internal structure composition, and potential modes and/or regions where failure occurred. A material may appear undamaged from the outside even when pores, cracks, fluids, or other changes are developing within it. Tomography allows engineers to locate those features and compare them with the sounds, graphs, and surface images collected earlier.
Finally, once engineers have a complete picture of how failure has developed in a material, they can use that data to inform and further develop programs that can then model future behavior.
A simulation can reveal forces and changes that cannot be seen directly. However, like the AI systems discussed prior, a model is only as reliable as its results are reproducible. By extension, a model’s prediction carries more weight when that prediction coheres with experimental exhibits like those I’ve shown here. This emphasis on comparing evidence reflects the NIST AI Risk Management Framework, which treats reliability, transparency, and accountability as important parts of trustworthy AI.
 Ashton Petersen
Leave a comment